Consider the two triangles below. They are similar triangles.
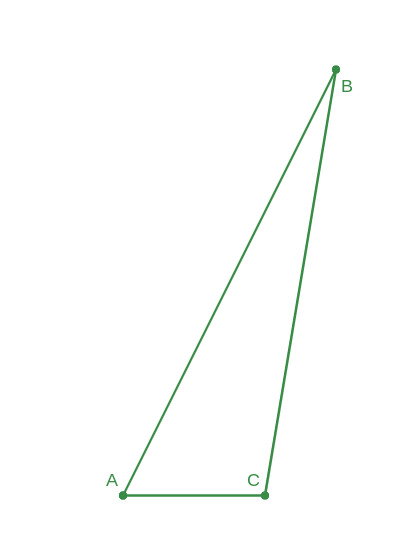
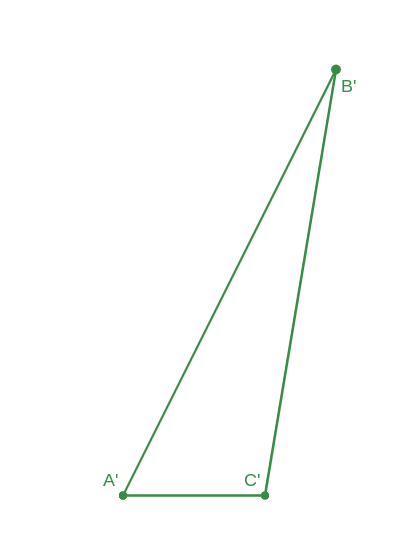
Indicate whether the following equations are true or false. Note: AB=4, BC=3, AC=1
$$ 4) \frac{AB}{BC} = \frac{A'B'}{B'C'} $$
$$ 5) \frac{BC}{CA} = \frac{A'C'}{B'C'} $$
1) Students were polled as to whether or not they had a pet. The results of the survey are shown below. Complete the chart.
| Yes | No | Total | |
|---|---|---|---|
| 11th Grade | 25 | 60 | |
| 12th Grade | |||
| Total | 80 | 130 |
2) A local trade union consists of plumbers and electricians according to rank. A survey is given to record their trade and rank. The results are shown in the table below.
| Apprentice | Journeyman | Master | Total | |
|---|---|---|---|---|
| Plumbers | 25 | 20 | 30 | 75 |
| Electricians | 15 | 40 | 20 | 75 |
| Total | 40 | 60 | 50 | 150 |
a. What proportion/ratio of people in this survey are apprentices?
b. What percent of plumbers are ranked as masters?
c. What percent of journeyman are electricians?
3) The table below shows values of °N latitude and °F for record lows for cities and towns located in the continental United States. Enter the following table in Desmos and answer the questions below.
| City | °N Latitude | °F (record low) |
|---|---|---|
| Hartford, CT | 42 | −26 |
| Columbus, Ohio | 40 | −22 |
| Woodstock, VT | 44 | −43 |
| Maybell, Ohio | 41 | −61 |
| Death Valley | 37 | −15 |
| Gainesville, FL | 30 | 6 |
| Austin, Texas | 30 | −2 |
| San Diego | 33 | 25 |
| Charlotte, NC | 35 | −5 |
| Cincinatti | 39 | −25 |
a. What is the equation for the best fit line?
b. What is the correlation coefficient, r?
c. What does the r value tell you about the association between degrees North latitude and record low temp?
d. What does the best fit line predict the record low temp will be for a city located at 25° N latitude?
e. What does the best fit line predict the record low temp will be for a city located at 50° N latitude?
Consider the two triangles below. They are similar triangles.


Indicate whether the following equations are true or false. Note: AB=4, BC=3, AC=1
$$ 4) \frac{AB}{BC} = \frac{A'B'}{B'C'} $$
$$ 5) \frac{BC}{CA} = \frac{A'C'}{B'C'} $$
7) Are the triangles below similar. Explain your reasoning.
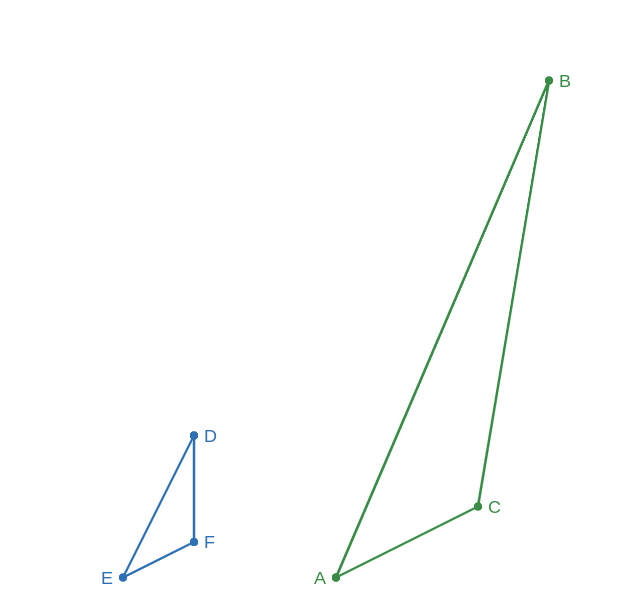
AB = 6, BC = 5, AC = 1.5, ED = 2, BC = 1.25, EF = 0.5
8) What is the scale factor that takes ABC to A'B'C'?
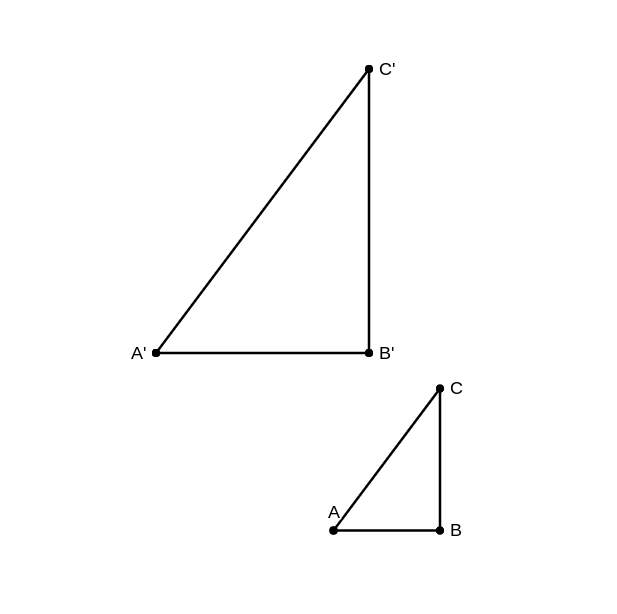
Note: AB = 3, BC = 4, CA = 5, A'B' = 4.5, B'C' = 6, C'A' = 7.5
Consider the image below and then complete the similarity statement below.
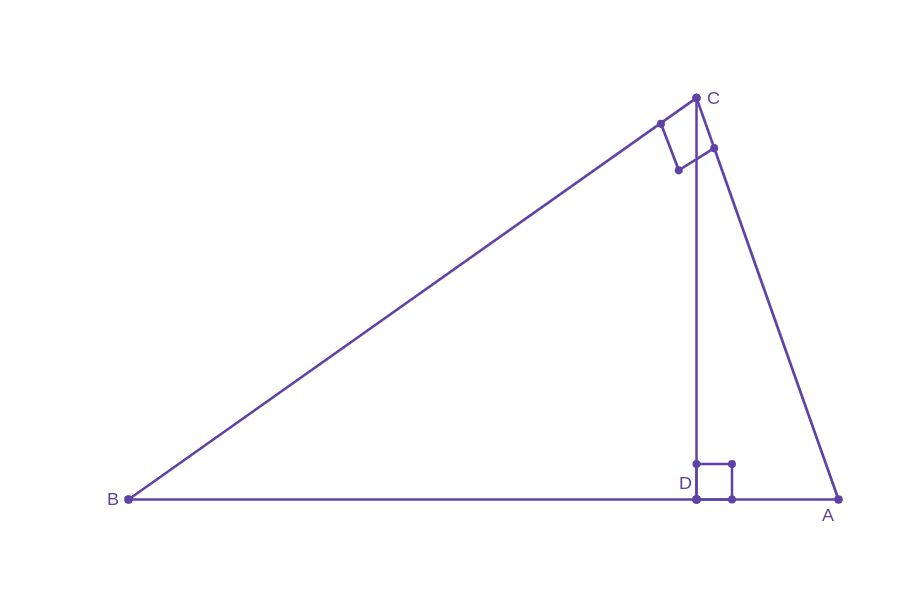
Note: BD = 16, DA = 4, AC = 12
$$ 9) \Delta{ABC} \sim \Delta \underline{ } \sim \Delta \underline{ } $$
Then find the lengths of segments BC and CD.
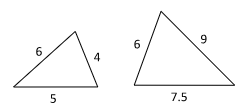
Determine if the pairs of triangles below are similar. If so, identify the theorem that proves they are similar. If not, explain why.
10)
11)
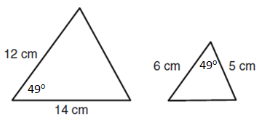
12)
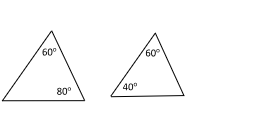
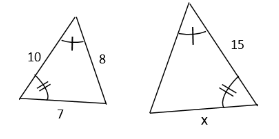
13) Write a proportion and solve for x:

14) These triangles are similar. Solve for x.
15) A survey asks two questions. Do you play sports? Do you play an instrument? The results are summarized in the Venn diagram below.
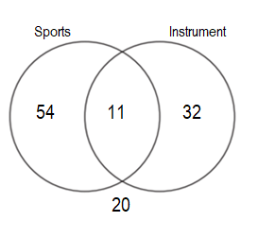
a. How many students responded to the survey?
b. Find the probability that a randomly selected student plays an instrument?
P(instrument only) =
c. Find the probability that a randomly selected student plays sports and an instrument.
P(Sports and Instrument) =
d. Find the probability that a randomly selected student doesn't play sports.
P(Does not play sports) =
e. Find the probability that a randomly selected student doesn't play sports and doesn't play an instrument.
P(Does not play sports and does not play an instrument) =
f. If a student that plays sports is selected at random, what is the probability that they also play a sport as well?
16) A total of 150 juniors and seniors are surveyed about their favorite school subject (even though math is the only subject that counts ... get it? I'm here all week ...) Anyways here is the data from the survey.
a. Complete the two-way table.
| Math (the only subject that counts) | English | Science | |
|---|---|---|---|
| Junior | |||
| Senior |
b. Are the events "like science" and "is a senior" independent? Explain how you know.
17) Records from a random sample of dairy farms for the years 1998-2003 yielded the information below on the number of male and female calves born at various times of the day.
The data is recorded in the table below.
| Day | Evening | Night | Total | |
|---|---|---|---|---|
| Males | 129 | 15 | 117 | 261 |
| Females | 118 | 18 | 116 | 252 |
| Total | 247 | 33 | 233 | 513 |
a. What is the probability that a calf is female or born in the evening?
b. What does the probability P(night | male) represent for this survey?
c. Find the value of P(night | male).
18. The director of a small community of senior citizens is writing a report about the types of technology used by its residents. The report includes these statements:
Suppose a resident who has a television is selected at random. Is there enough information to find the probability that the selected resident also has a cell phone? If so, find the probability. If not, what additional information do you need to know?
19. The row relative frequency table shows the percentage of each type of art (painting or sculpture) in a museum that would classify in the different styles (modern or classical).
| modern | classical | |
|---|---|---|
| paintings | 41% | 59% |
| sculpture | 38% | 62% |
What does the 41% represent?
What does the 59% represent?
What does the 38% represent?
What does the 62% represent?
20. A census of students at a very large high school was taken and each was asked their grade level and in which location they ate lunch every day. The results are summarized below.
| Large Cafeteria | Small Cafeteria | Student Center | Total | |
|---|---|---|---|---|
| Freshmen | 110 | 435 | 80 | 625 |
| Sophomore | 250 | 275 | 125 | 650 |
| Junior | 375 | 150 | 110 | 635 |
| Senior | 350 | 0 | 280 | 630 |
| Total | 1085 | 860 | 595 | 2540 |
a. Find the probability that a student selected at random is a junior.
b. Find the probability that a student selected at random ate lunch in the student center.
c. Find the probability that a student selected at random is a junior and ate lunch in the student center.
d. Find the probability that a student selected at random is a junior or ate lunch in the student center.
e. Find the probability the student is a junior under the condition that they ate in the student center.
f. TRUE or FALSE: P(senior | large cafe) < P(senior | student center)
21. The table shows the types of pets each student has.

a. How can you describe the event that includes students A, B, and E without including any of the other people?
b. How can you describe the event that includes students A, B, C, and D without including any of the other people?
c. How can you describe the event that includes students A and B without including any of the other people?
22. After a recent winter storm, there was an icicle hanging from the edge of the roof outside Andrew’s window. The temperature rose above 32 degrees and the icicle started to melt. Andrew measured the length of the icicle at various times during the day and recorded his observations in the table below.

a. Use technology to compute the best fit line. Round any numbers to 2 decimal places.
b. What is correlation coefficient (r-value)? Round to the nearest hundredth.
c. Use the equation to estimate the length of the icicle after 6 hours.
d. Use the equation to estimate the number of hours it will take for the icicle to reach a length of 4.5 inches.
23. Annabelle bought a new fish tank for her pet fish Hermes. On the third day, she notices that the fish tank is leaking water. Each day she measures the depth of the water in the tank. The table shows the number of days since she filled the fish tank with water, x, and the depth of the water, y, in centimeters.

| Day | Depth (cm) |
|---|---|
| 3 | 27.4 |
| 4 | 27 |
| 5 | 26.5 |
| 6 | 25.9 |
| 7 | 25.5 |
| 8 | 24.9 |
| 9 | 24.5 |
The data in the scatter plot suggest a linear association. A line to model the data is given by the equation:
a. Is the line given a reasonably good fit? Explain your reasoning.
b. Identify the slope and then explain the meaning of the slope of the line in this situation.
c. What is the value of the y-intercept for the best fit line? What does the y-intercept mean in the context of the situation?
d. Describe the correlation between the variables as either strong or weak and as either positive or negative. Explain your reasoning.
24. A cell phone company collected data on the amount of time people spend on their phone and the number of text messages they send. The results are shown in the scatter plot (below). The equation for the line of best fit and correlation coefficient are given below.
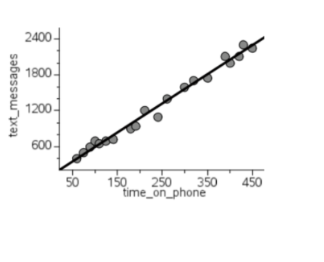
Select ALL of the statements that are true.
25. A car dealership is comparing the age and price of cars that they have recently sold. They create a scatter plot using the data with the age of the car, in years, along the x-axis and the price that they sold the car, in dollars, along the y-axis.
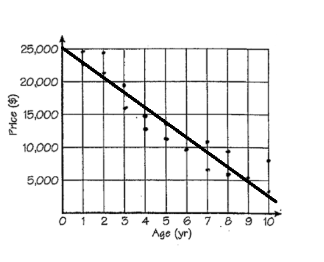
The data in the graph suggest a linear association. Which of the functions best represents the equation of the line of best fit?
26. Amelia collects data about the number of fast food restaurants in a town and the average real estate price. Amelia says, “The scatter plot between the number of fast food restaurants in a town and the average real estate price shows a strong and negative correlation.”
a. What does it mean for the relationship between the variables when the correlation is strong in this situation?
b. What does it mean for the relationship between the variables when the correlation is negative in this situation?
27. Match the following r values with the correct graphs below: r = 0, r = 1, r = -0.6, r = 0.7
